
TL;DR
- Problem: Negative Twitter experiences can affect the platform’s retention and user growth rate. I aimed to understand people’s Twitter experiences to improve these metrics. Twitter’s growth rate for 2022 is 2% while its global retention rate is 84.1%.
- Role: UX Researcher
- Duration: 3 weeks
- Approach: I ran a survey for ten days and explored the data with Excel, Python and a bit of R.
- Discovery: I found that 73% of my sample use Twitter for news, 37% for trends and comedy and 28% for networking. Likewise, the quality of twitter’s content affects how people feel about Twitter and the amount of control they have over Twitter affects how they use the platform.
- Outcomes: I recommended optimising Twitter for news, networking and trends and granting people more flexibility to control their Twitter feeds beyond the available options. If Twitter does this, it’ll improve its global retention and user growth rate.
Skip to 💨
My grouse with Twitter
Twitter is one of the most popular social media networks but, it’s not my favourite. When I started using it, I observed how toxic and hateful it could be. Once I had had enough, I shut it down.
Yet, I wondered why irrespective of Twitter’s toxicity, it has over 320 million users. I wondered if the app’s negativity affected how people used it just like it did to me.
Timeline: 3 weeks
Role: UX Researcher
Team: 1 UX Researcher
Capturing Twitter experiences
Goal
I aimed to understand people’s experiences (what people see, think and feel about Twitter) and how it affects how they use Twitter to improve its retention and growth rate.
The data would help increase Twitter’s user base since bad experiences can negatively affect Twitter’s user base and reputation.
My goals were:
- To define how people use Twitter.
- To discover how people feel about their experiences on Twitter and how it affects their Twitter time.
Goals
To accomplish my goals, I asked the following questions:
- What do people use Twitter for?
- How do people experience Twitter?
- How do these experiences affect Twitter usage?
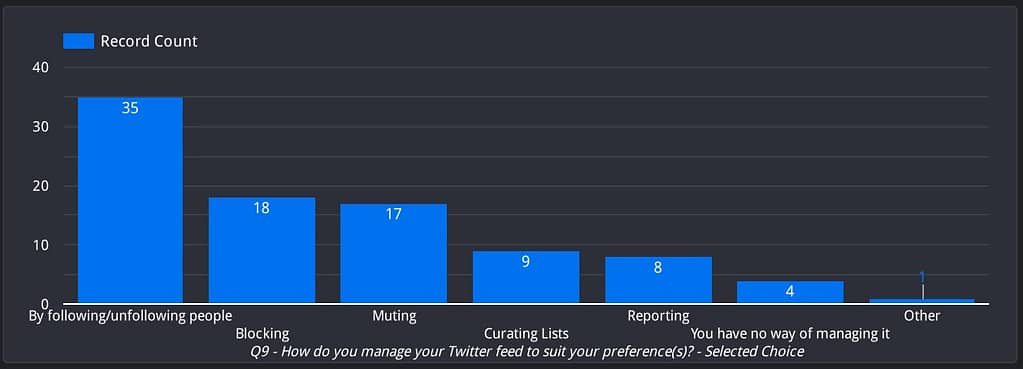
- How do people streamline/manage their Twitter experience? Do the current options for streamlining suffice?
Hypotheses
Generally, I hypothesised that Twitter’s toxicity affected the amount of time people spent using it.
My hypotheses were:
- The proportion of people whose experience with Twitter’s content is awful will be 45% or more of the sample.
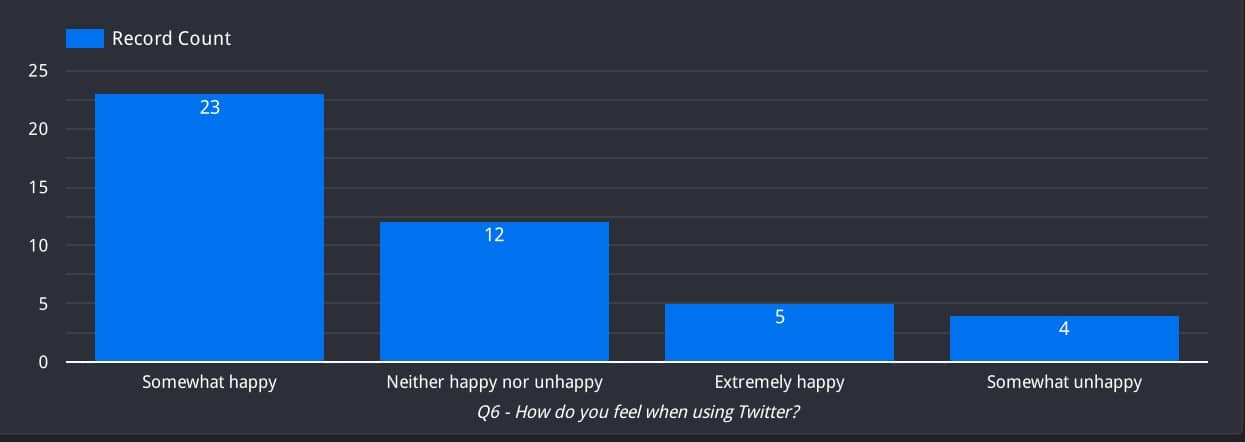
- The proportion of people whose feelings about Twitter are extremely unhappy will be 45% or more of the sample.
- The experience people have with Twitter and how people feel about Twitter are significantly associated with how people use Twitter.
- There is a significant association between one’s ability to control their Twitter feed and how one feels about Twitter when using it.
High-level process

What’s out there?
Twitter is a popular social media platform so I knew I would find useful data online. I found:
- Twitter’s global retention and growth rates for 2022 are 84.1% and 2% respectively.
- Twitter can be a toxic place for women.
- But Twitter isn’t all that toxic. The experience varies.
- Twitter has put in place ways for people to customise their experience.
- People use Twitter because of the gratification they get from the content and interactivity.
I was interested in the experiences of tweeps, the factors that affected those experiences, and what drove people to use Twitter.
Data collection
With the desk research and project’s aim at hand, I decided to use a survey to collect the data. I wanted a holistic and quantified view of the subject. I ran the survey for 10 days after testing with 10 people and collected 44 valid responses out of 48. I only considered those who used Twitter at least once a week.
Before I shared the survey, I tested it with ten people to ensure that the questions were clear. I considered participants who use Twitter at least once a week. As a screener, I asked, “In the past 7 days, how many times did you use Twitter?” Since I was attempting to understand how people used Twitter and if it affected their use time, it felt suitable to consider those who used Twitter and had some knowledge of the platform. In my opinion, this was better than outrightly asking participants if they used Twitter.
Invalidating my Twitter bias
My analysis began by grouping the qualitative responses. I performed a chi-square test of good fit and Fisher’s exact test where applicable and visualised the data with Data Studio.
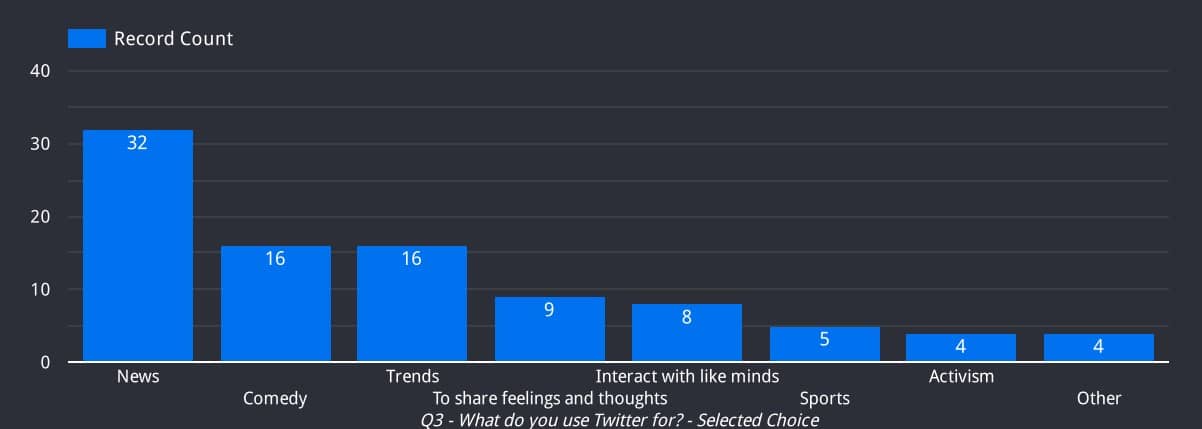
I found that 73% of my sample use Twitter for news, 37% for trends and comedy and 28% for networking. Likewise, the quality of Twitter’s content affects how people feel about Twitter and the amount of control they have over Twitter affects how they use the platform.
I recommended optimising Twitter for news, networking and trends and granting people more flexibility to control their Twitter feeds beyond the available options.
Read more…
- For this case study, I summarised each finding. But if you wish to read more about what I found and how they tested my biases, read this article.
- If it interests you check out the code I used for the hypotheses tests.
Findings
- Most people use Twitter as a source of news (73%), comedy (37%) & trends (37%)
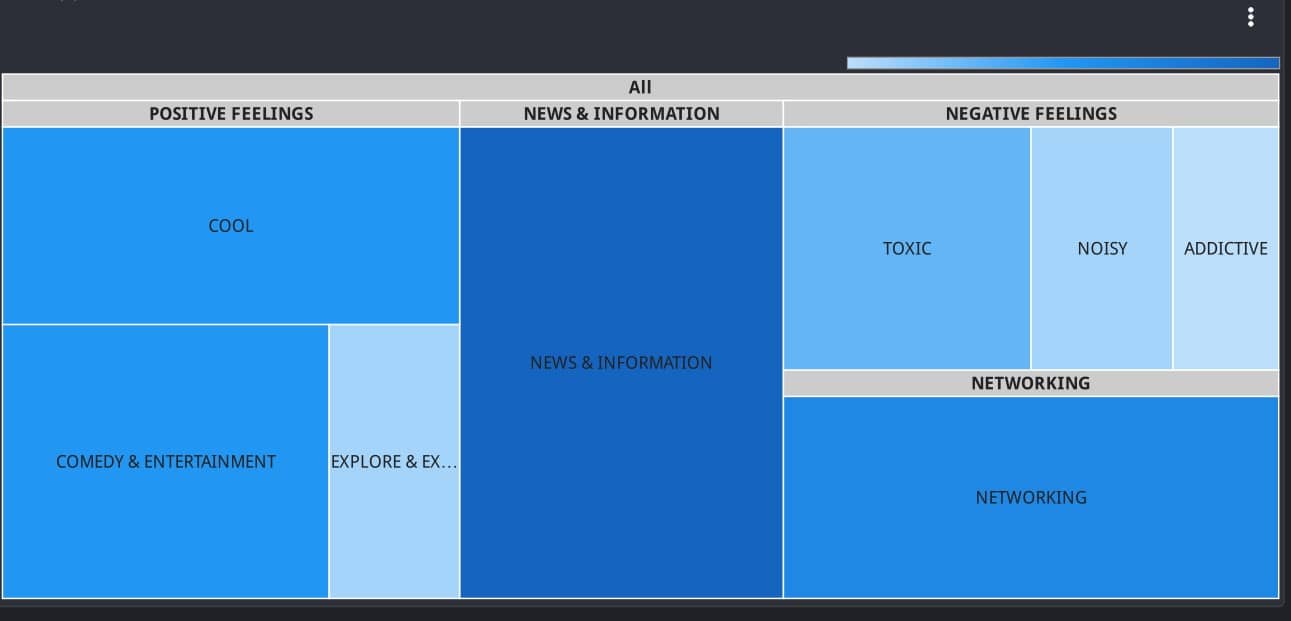
- People are in a love-hate relationship with Twitter. These are the features: Positive feelings (55%), News and information (39%), Negative feelings (32%) and Networking (28%).
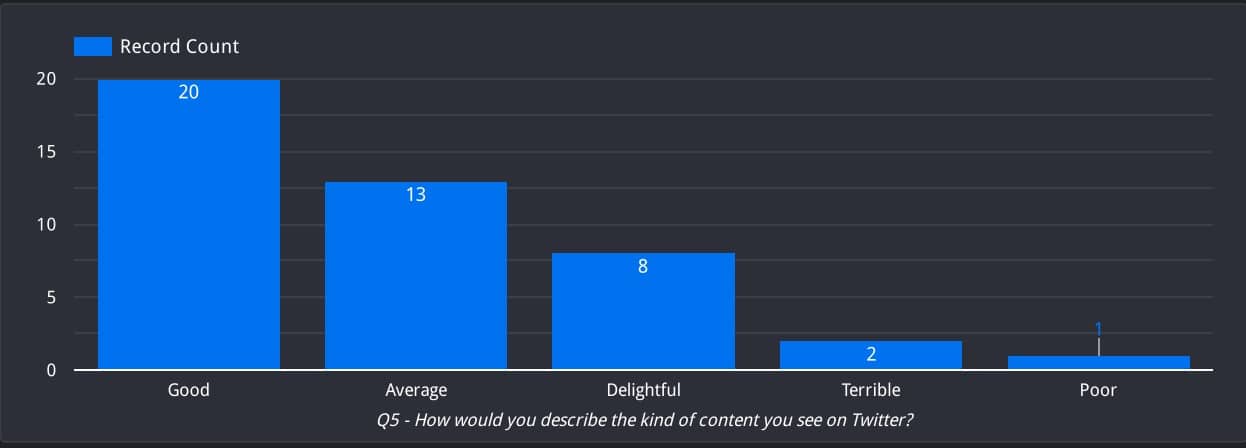
- Contrary to my 1st and 2nd hypotheses, most people think the content on Twitter is good and feel somewhat happy when using the platform. This might relate to the fact that 73% of the sample uses Twitter for news.
- There’s a chain reaction: Twitter’s content affects how people feel when using Twitter. How people feel when using Twitter affects how they use it!

- One’s ability to control their Twitter feed connects to how one feels when using Twitter
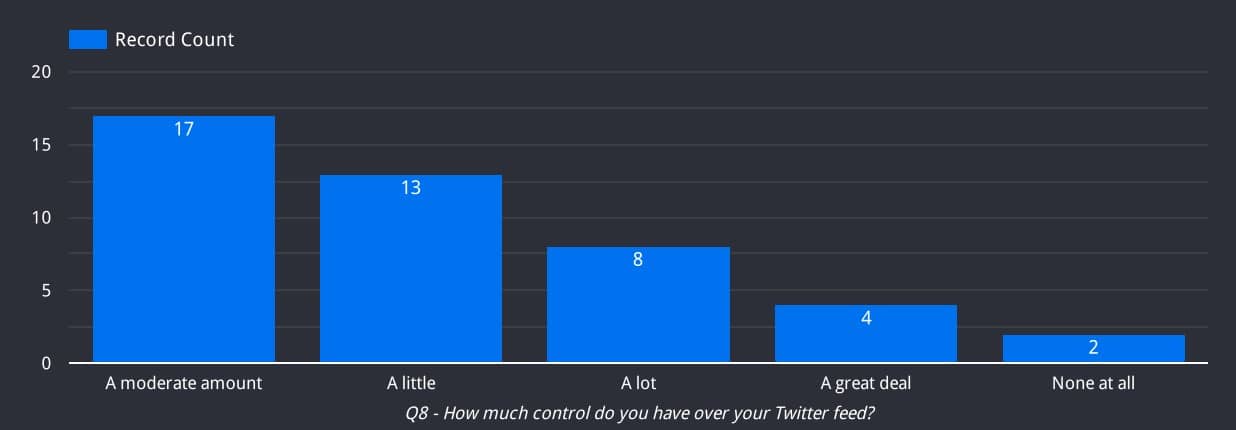
- Most (39%) tweeps have moderate control over their Twitter feeds because the current options that allow them to control their feeds are insufficient.
Recommendations
- Give Twitter users more control and flexibility over their feeds.
- For those who centre their Twitter use on news, comedy, trends, and networking, optimise the platform to suit these needs.
Outcomes
Potentially increase Twitter’s retention & user growth rate
It all boils down to control. If Twitter can allow people to optimise its platform based on their interests (news, trends, comedy and networking) and enhance the ability to control Twitter feeds, Twitter would grant its user base maximum satisfaction while simultaneously improving its retention and growth rates.
Disproved hypothesis
The study surprisingly disproved three of my hypotheses. I expected most people to echo my sentiments about Twitter. I was wrong. We can never be too sure about what we’ll find until we conduct research.
Limitations
There’s still a lot to explore and while I enjoyed conducting this study I encountered two limitations.
Small sample size
This is the biggest limitation of this study. While my sample size surpasses 30, I still feel my results would have been more accurate with a larger sample.
Better survey questions
Asking unbiased and non-leading questions is difficult. I tried as much as possible to prevent bias in my questions, but I still feel I could have made them better.